DMI – Graduate Course in Computer Science
Copyleft
2019 Giuseppe Scollo
this tutorial deals with a hardware acceleration case study
the previous lab tutorial presented a software implementation of the delay computation of a Collatz trajectory with given start point
hardware implementations of the same function were the subject of previous lab experiences
the performance measurements carried out on the software implementation show that it consumes almost all of the program execution time
a first alternative to evaluate: to integrate the hardware function as a custom instruction or as a memory-mapped coprocessor?
other design decisions depend on this first decision, as follows
the VHDL description of the circuit which computes the function is to be embedded into a component equipped with Avalon interfaces for the Clock, Reset, and Avalon MM Slave signals, so as to receive the initial data by a write operation and to return the result by a reply to a read operation
addressing of the coprocessor: since the (initial data) write and (final result) read operations take place at different times and have the same data size, a single address suffices
software driver : two macros and a function may be defined for the bus access software interface: DC_RESET(d), DC_START(d,x0), unsigned int delay(d), where d is the address assigned to the coprocessor
development main phases:
two VHDL sources implement the memory-mapped coprocessor:
both files are available in the vhdl folder of the attached archive, which is also located in the Nios II folder of the reserved lab area
consultation of the delay_collatz_interface.vhd source shows the relationships between the I/O signals of the computational component and the Avalon interface signals
folder codesign in the attached archive is preset to host the project development
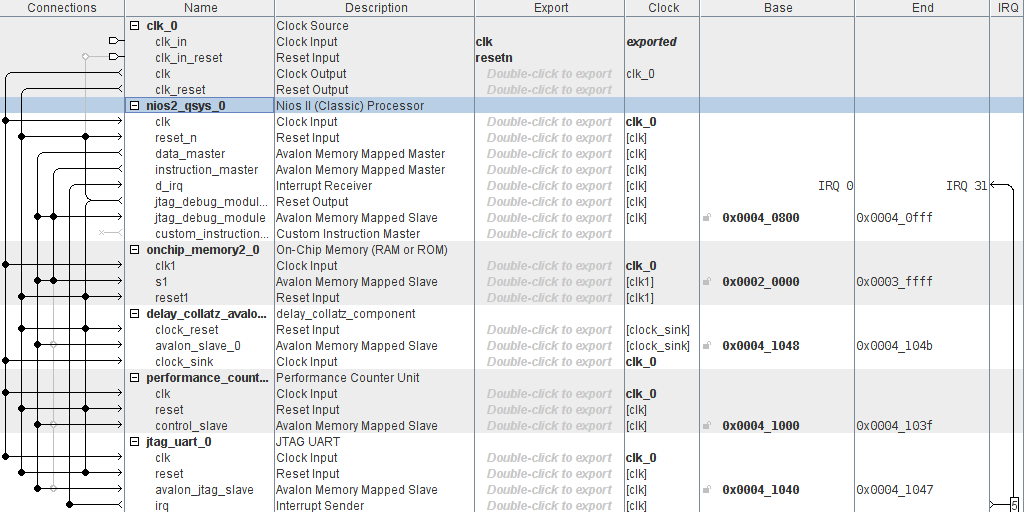
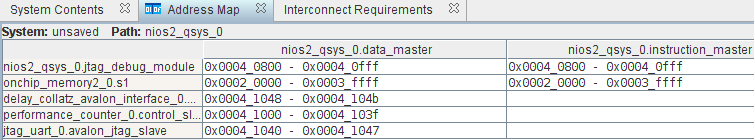
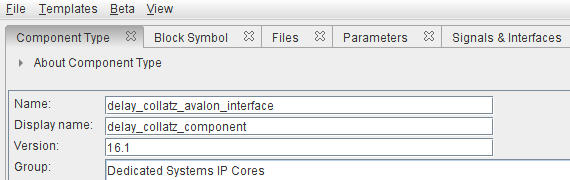
after creation of project delay_collatz_codesign, with top-level entity having the same name, the construction of the custom component delay_collatz_interface may proceed
the new component type definition is shown in the figure
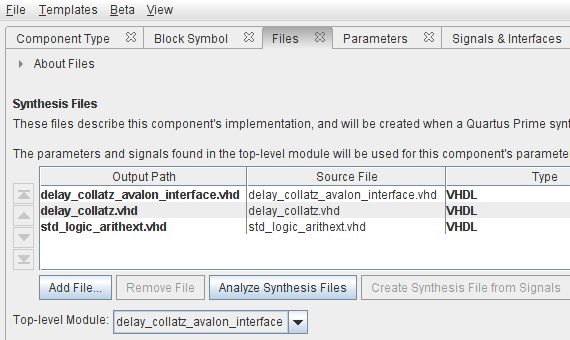
the next step is the assignment of VHDL files that describe the component and their analysis, as shown in the figure
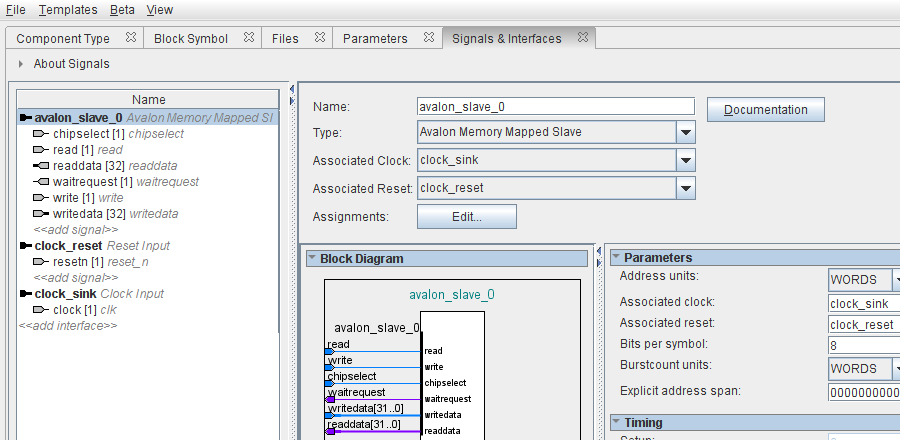
finally, the new component definition ends with the definition of its Avalon interfaces and placement of its signals under the appropriate interfaces, as shown in the figure
for the construction of the Nios II system shown in the previous figures it may be useful to consult the Qsys introduction tutorial
the final steps to map the system to the FPGA are as follows:
in Qsys:
exit Qsys, then in Quartus:
folder script in the attached archive contains two TCL scripts for the generation of the software driver in the BSP for the project
these two scripts are to be copied in folder codesign/ip/delay_collatz_avalon_interface
the TCL scripts were written by analogy with the TCL script for the software
driver of the Performance Counter, available in the Quartus Prime Lite 16.1
distribution under path
$SOPC_KIT_NIOS2/../ip/altera/sopc_builder_ip/altera_avalon_performance_counter
the motivation for this, perhaps unorthodox, way of producing the software driver lies in the twofold fact that
together with a somewhat reasonable level of operational analogy between the two components
folder src in the attached archive contains the subject programs, which are to be copied in the provided folders for the creation of test and performance measurement projects under the Monitor Program, as follows:
project creation parameters are summarized in the attached file MonitorNotes.txt
main differences between the source of lab tutorial 10 and the present sequential version:
the pipelined version of the program exhibits much stronger differences with respect to the program of lab tutorial 10:
the synchronization mechanism is very simple, thanks to properties of the custom component and of the waitrequest signal of the Avalon MM protocol:
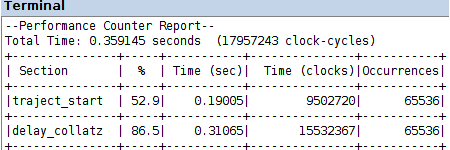
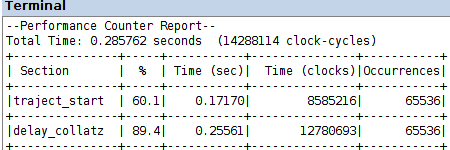
compilation, loading on the FPGA and execution of program delay_collatz_sequential_timing.c, in the two projects codesign/amp_s and codesign/amp_s_o3, produces the Performance Counter Reports in the figure
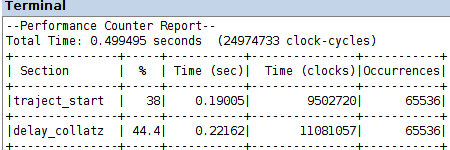
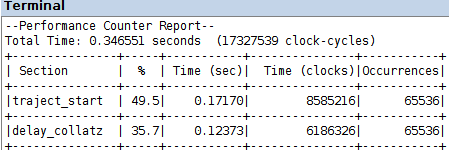
a speed-up by an order of magnitude, w.r.t. the software computation in lab tutorial 10, results from the performance data in that case, with the same optimization levels
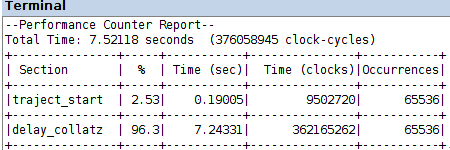
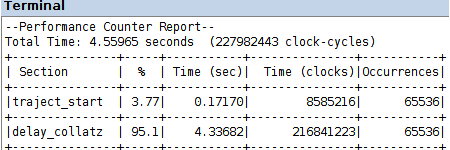
it is sensible to expect a further performance gain out of the nonblocking execution of the computation by the custom hardware
the comparison of the following Performance Counter Reports with the corresponding data for the implementation with all computation done in software, yields a 21x speed-up with default optimization O1 and a 16x speed-up with optimization O3; the corresponding speed-up values with blocking acceleration are 15x with O1 and 13x with O3
useful materials for the proposed lab experience: