pencil and rubber

Logo of Triple-A Level WCAG-1 Conformance, W3C-WAI Web Content Accessibility Guidelines 1.0

XHTML 1.0 Conformance Validation CSS 3 Conformance Validation
Logo of Department of Mathematics and Computer Science, Course on Dedicated systems, link to Forum

SoC development on FPGA with application profiling

Tutorial 09 on Dedicated systems

Teacher: Giuseppe Scollo

University of Catania
Department of Mathematics and Computer Science
Graduate Course in Computer Science, 2017-18

Table of Contents

  1. SoC development on FPGA with application profiling
  2. tutorial outline
  3. system integration in SoC development
  4. tools for software application profiling
  5. construction of a Nios II system with performance counter
  6. a simple, well-known example
  7. use of the performance counter in the software application
  8. BSP generation and HW/SW integration
  9. debugging and execution
  10. lab experience
  11. references

tutorial outline

this tutorial deals with:

system integration in SoC development

development of a SoC with applications is a typical HW/SW codesign activity

the Quartus tool utilized in this lab tutorial for the integration of hardware components in SoC development is Qsys

a slightly more complex example is the subject of the present tutorial:

tools for software application profiling

profiling a program: measuring the time spent in different parts of the program, to identify those which are critical to execution speed

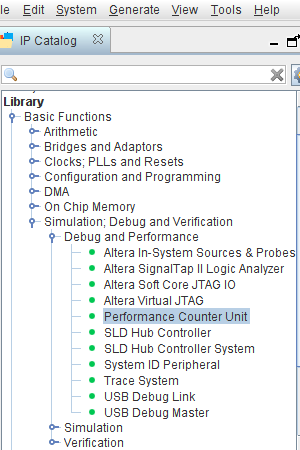
three tools considered in (fairly dated) document Profiling Nios II Systems :

  • GNU gprof : software measurement, high software overload, high measure distortion
  • Interval Timer : hardware measurement, minimal resource overload, limited distortion
  • Performance Counter Unit : hardware measurement, significant hardware overload, minimal distortion, upperbound (7) on no. of measurable program sections

the third method is utilized here, since it yields the best accuracy and the easiest use within the program, while the aforementioned upperbound is no problem for the application at stake

Performance Counter Unit IP Core in the Qsys IP Catalog

construction of a Nios II system with performance counter

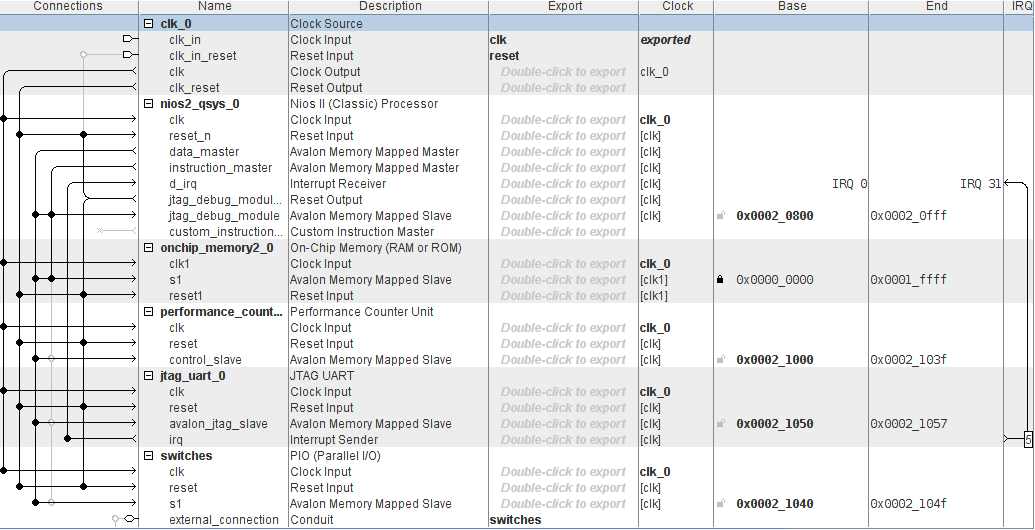
the figure displays the Qsys contents of the Nios II system with Performance Counter Unit

Qsys Contents of Nios II system with Performance Counter Unit

a simple, well-known example

the C function in the figure is a software implementation of the delay computation of a Collatz trajectory with given start point

CPP directives and C function for the delay computation of a Collatz trajectory

use of the performance counter in the software application

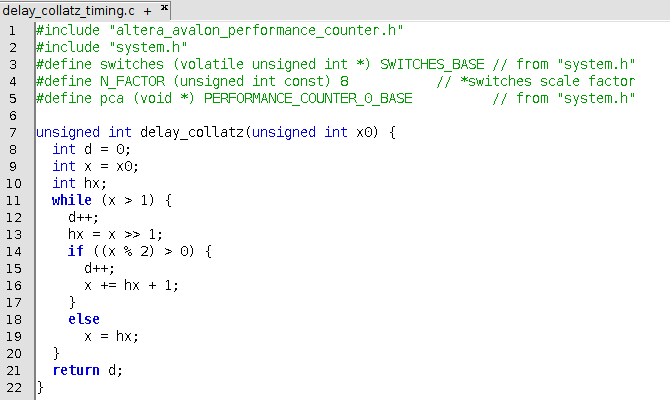
unlike the previous lab experiences relating to hardware implementations of the subject function, the user input here determines the length of the sequence of trajectories to be generated in the main program, that is the number of function invocations

main program of the profiling application for the Collatz delay computation

BSP generation and HW/SW integration

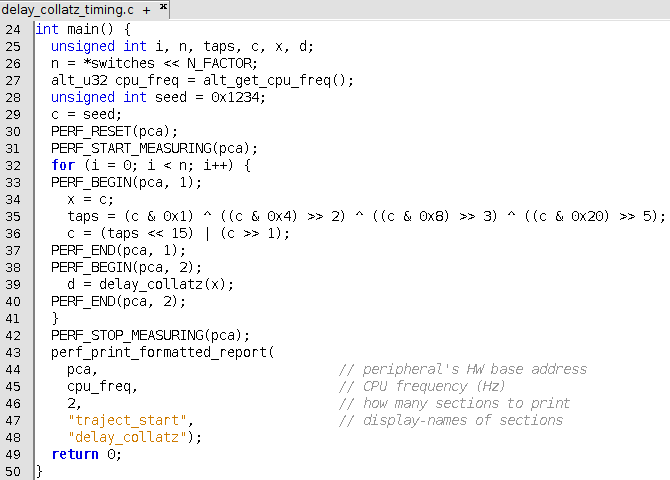
the preprocessing directives, previously shown, enable the use of the performance counter API as well as of other symbols (SWITCHES_BASE in this case) defined in the software interface of the system built with Qsys

the interface is provided by the BSP, whose construction here is automated by the Monitor Program, following the choice of program type Program with Device Driver Support

choice of the application program type in the Monitor Program

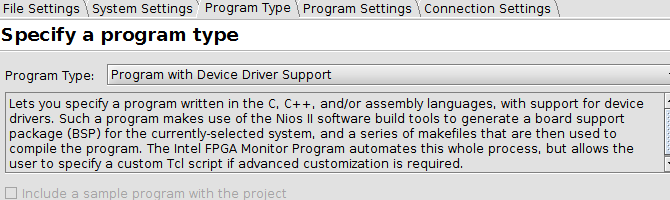
other aspects of the BSP (e.g. compiler or linker options) may be specified by providing a custom Tcl script

  • in particular, while the default optimization level fixed by the Monitor Program is -O1, a different level, e.g. -O3, may be obtained by creating a one-line script (with extension .tcl):
    set_setting hal.make.bsp_cflags_optimization -O3
    and providing its path in the input box BSP settings Tcl script (optional) within the Program Settings tab

debugging and execution

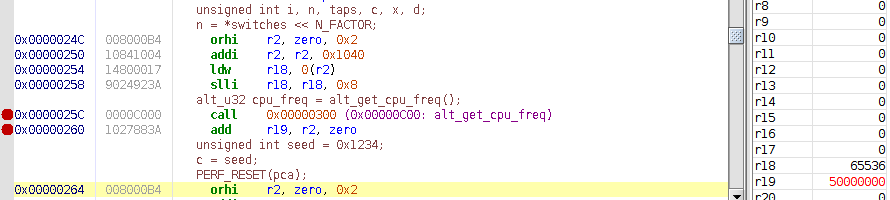
C source-level debugging is also available in the Monitor Program (visualization of values of variables)

the program disassembly remains accessible anyway, where to set breakpoints and to examine its execution status at critical points for correctness verification

...

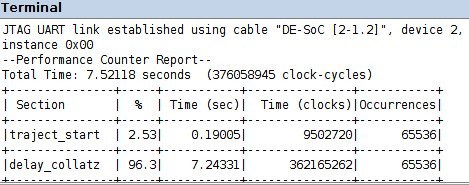
after removal of all breakpoints, system reset and execution restart, the profiling module generates the performance report displayed in the figure

Performance Report produced by profiling under execution with no breakpoint

lab experience

the proposal aims at the design and implementation of a HW/SW system with similar structure and features as those of the example presented in this tutorial, using the same development and profiling tools, but for a different application; precisely, the work goes about:

references

recommended readings:

readings for further consultation:

useful materials for the proposed lab experience: